Impact Report
The Impact Report shows the benefits Secure Email Threat Defense provided over the last 30 days. Select Insights > Impact Report to see the report. Click data of interest in the report to be taken to the data details on the Messages page.
Data shown includes:
-
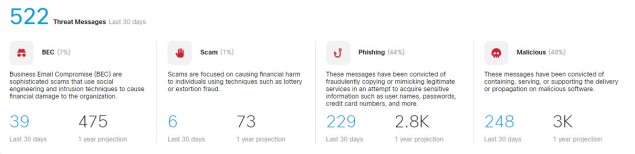
Threat messages caught by Secure Email Threat Defense in the selected 30 day period, and a 1-year projection of this data. The 1-year projection is calculated as the daily average multiplied by 365.
-
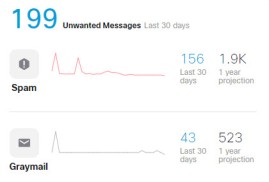
Unwanted Messages. This chart shows Spam and Graymail in the selected 30 day period, and a 1-year projection of this data. The 1-year projection is calculated as the daily average multiplied by 365.
-
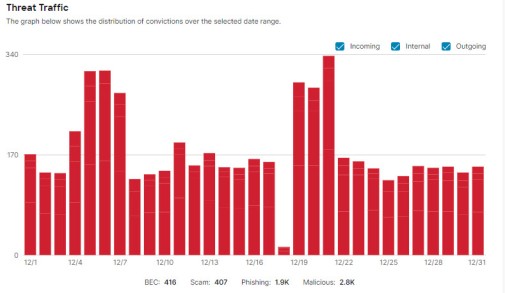
Threat Traffic. This chart shows convictions over the selected 30 day period. You can filter this chart by direction.
-
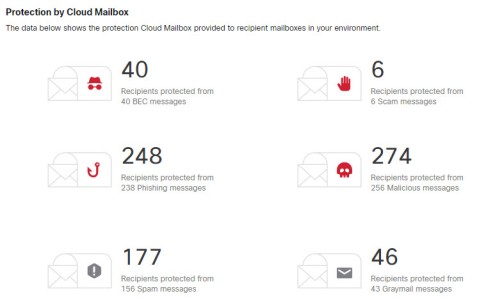
Protection by Secure Email Threat Defense. This chart shows the protection Secure Email Threat Defense provided to recipient mailboxes in your environment.
-
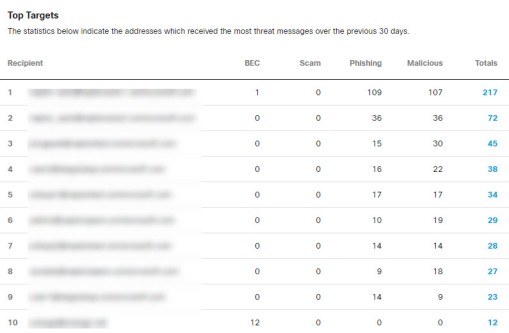
Top Targets. This chart shows the top ten internal targets of threat messages over the selected 30 day period.
-
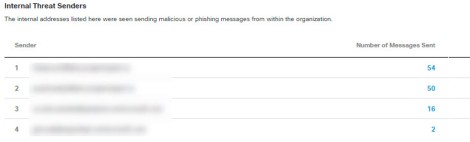
Internal Threat Senders. This chart shows the top ten internal senders of threat messages.